Outdoor 5G Channel Measurement using COTS UEs
Platform: ARA COTS platform
- Resources Needed:
Ericsson Base Station: RP 6647 (base band), AIR 6419 (mid-band radio), AIR 5322 (mmWave radio)
COTS UE: Quectel RG530 and computer hosting the Quectel radio.
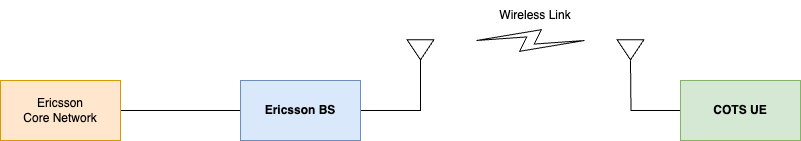
Description: The experiment is designed to measure the wireless channel characteristics using COTS UE from an already established Ericsson RAN. Please note that in this experiment, we do not establish any link. However, we measure the characteristics of an existing link. The experiment uses a container only at the UE with a script for measuring the channel characteristics. The following figure shows the Ericsson network used for the experiment.
Detailed Steps
Login to ARA portal with your username and password.
Note
If you are a first time user, it is highly recommended to run the Hello World experiment experiment first to get familiarized with the interface and the portal.
Create a reservation using the Project -> Reservations -> Leases tab from the dashboard with the following attributes:
Site: Ames
Resource Type: AraRAN
Device Type: User Equipment
Device ID: 000
Note
For this experiment, you DO NOT need to reserve any Base Station node. The measurement is performed only at the UE side.
In general, you can use any UE which is equipped with COTS Quectel radio. The following table provides the list of UEs that support this experiment.
List of Supported Fixed-location UEs for COTS Measurement Site
Resource Type
Device Type
Device ID
Ames
AraRAN
User Equipment
000 and 140
Curtiss Farm
AraRAN
User Equipment
000, 001, and 002
AgronomyFarm
AraRAN
User Equipment
000, 001, 010, 020, 031, and 035
FeedMill
AraRAN
User Equipment
000 and 001
Ames
AraRAN
User Equipment (Mobile)
Device ID
List of Supported Mobile UEs for COTS Measurement Site
Resource Type
Device Type
Device ID
Ames
AraRAN
User Equipment
120
Note
To check the availability of the mobile UE, navigate to Project -> Summary -> Mobile UE Map from the dashboard. This page displays a live map showing the mobile UE (i.e., the bus equipped with the UE) and its current location. A green bus icon indicates that the mobile UE is ready for experimentation, while a red bus icon indicates that the bus is outside ARA’s coverage area and not ready for experimentation.
Launch a container equipped using the container image
arawirelesshub/cots:baselinefor fixed nodes andarawirelesshub/cots:mobilefor mobile node. You can keep the other container attributes according to your choice.Once the container is launched, take a note on the floating IP and SSH to the container via the ARA jumpbox. Detailed instructions for accessing the container via jumpbox can be found here.
In the container, run the following commands to start the measurement script.
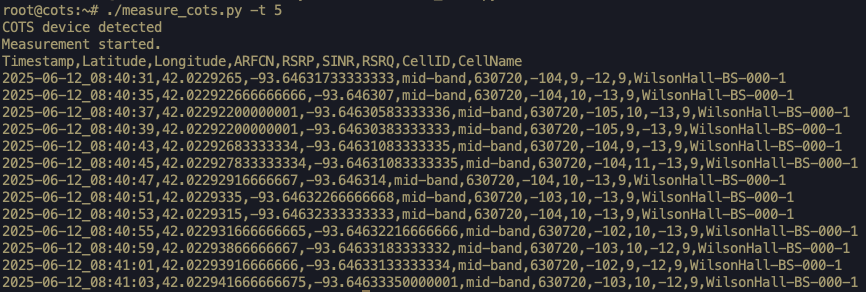
cd
./measure_cots.py -t 5
Here,
5represents the time in seconds we want to execute the measurement script and the samples are collected every 1 second. You can provide the experiment duration as required.For fixed UEs, the command produces the following output.

For mobile UEs, the command provides output that include the UE location (latitude and longitude) as well.
Note
Please note that the mobile node generates output only when the bus is within the coverage region of the ARA base stations. You can check the Project -> Summary -> Mobile UE Map menu in the ARA portal to view the bus’s position. It is recommended to run the command for at least 40 minutes (provided the bus is shown in green), to ensures that sufficient COTS metrics are collected.
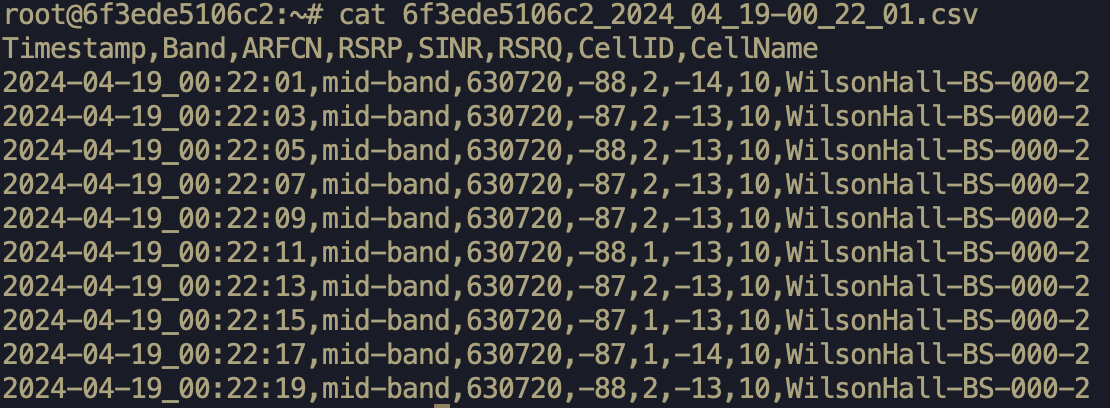
The command in Step 5 also generates an output file named
cots_YYYY_MM_DD-HH:MM:SS.csv(in CSV format) with the measurement data including the timestamp of the sample, band, ARFCN, RSRP, SINR, RSRQ, Cell ID, and Cell Name. You can see the content of the generated file using the following command. Note that the timestamp in the filename represents the time at which the measurement started.cat <filename>An example of the content of the file from the above command is shown below.
Note
The last column in the CSV file represents the Cell Name, which takes the form ResourceName-SectorNumber. For example, WilsonHall-BS-000-2 indicates the 2nd sector of the base station specified as WilsonHall-BS-000.
If you want to save output into a custom file, you can use the
-ooption as follows../measure_cots.py -t 5 -o output.csvThe above command will generate the file named output.csv. If you run the command multiple times using the same filename, the output will be appended to the same file.
Tip
If you want to perform weather measurements along with the RAN experiments, refer to ARA Weather APIs.