srsRAN Outdoor 5G SA Experiment with COTS UE
Platform: srsRAN software stack and Universal Software Radio Peripherals (USRPs)
Resources used: USRP NI N320 (BS), N320 host computer, Quectel RM5xxQ-GL (UE), Quectel host computer, power amplifiers, CommScope SS-65M-R2 Sector BS Antenna, and Quectel YEMN017AA Antenna.
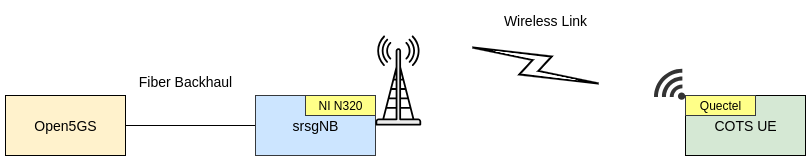
Description: This experiment features a 5G network deployment using containerized 5G software components of srsRAN_Project, i.e., a containerized srsgNB, a containerized UE running minicom, and a Quectel RM5xxQ-GL attached to the UE container. The core network is deployed in the data center and connects to the base station via long distance fiber backhaul connection. The following figure shows the 5G network created from the experiment.
Note
For srsRAN 5G experiments, there exists an Open5GS core network deployed at the data center. The core network always runs an iperf3 server in the background. Even though users do not have access to the core network for the experiment, they can run iperf3 and ping commands to communicate with the core network.
Detailed Steps for the Experiment
Login to ARA portal with your credentials.
Create two reservations using the Project -> Reservations -> Leases tab from the dashboard. Since each base station serves specific UEs in its footprint, we need to take extra care while reserving the nodes for experiments as well as setting the configuration parameters for gNB and UE. Following are the BS-UE combinations for the OAI outdoor experiment. You can make use of any resource combination listed below for your experiment.
Experiment Resource Combination 1 (for Curtiss Farm)
Resource No.
Site
Resource Type
Device Type
Device ID
1
Curtiss Farm
AraRAN
Base Station
000
2
Curtiss Farm
AraRAN
User Equipment
000
3
Portable
AraRAN
User Equipment
000
4
FeedMill
AraRAN
User Equipment
000, 001
Experiment Resource Combination 2 (for Agronomy Farm)
Resource No.
Site
Resource Type
Device Type
Device ID
1
Agronomy Farm
AraRAN
Base Station
000
2
Agronomy Farm
AraRAN
User Equipment
001, 010
Experiment Resource Combination 3 (for Gilbert)
Resource No.
Site
Resource Type
Device Type
Device ID
1
Gilbert
AraRAN
Base Station
000
2
Horticulture
AraRAN
User Equipment
000, 001
3
Gilbert
AraRAN
User Equipment
003
Create the containers on the respective nodes as provided in the following table.
Component/Reservation
Container Image
CPU
Memory
Network
Base Station (gNB)
arawirelesshub/srsran:gnb_v28
8192
ARA_Shared_Net
User Equipment (Quectel)
arawirelesshub/srsran:ue_v28
8192
ARA_Shared_Net
Once the container is launched, take a note on the floating IP if you want to access the container from your PC via ARA jumpbox. The containers can be accessed via the console tab of the respective containers in the Project -> Containers tab from the dashboard or using ssh via the jumpbox server. Visit ARA Jumpbox for more information on accessing containers via jumpbox.
In the gNB container, run the following command to check the radios connected to the host. In case the command cannot find SDR, refer the instructions in FAQ.
# uhd_find_devicesThe output of the above command should look like the following image.
Base Station
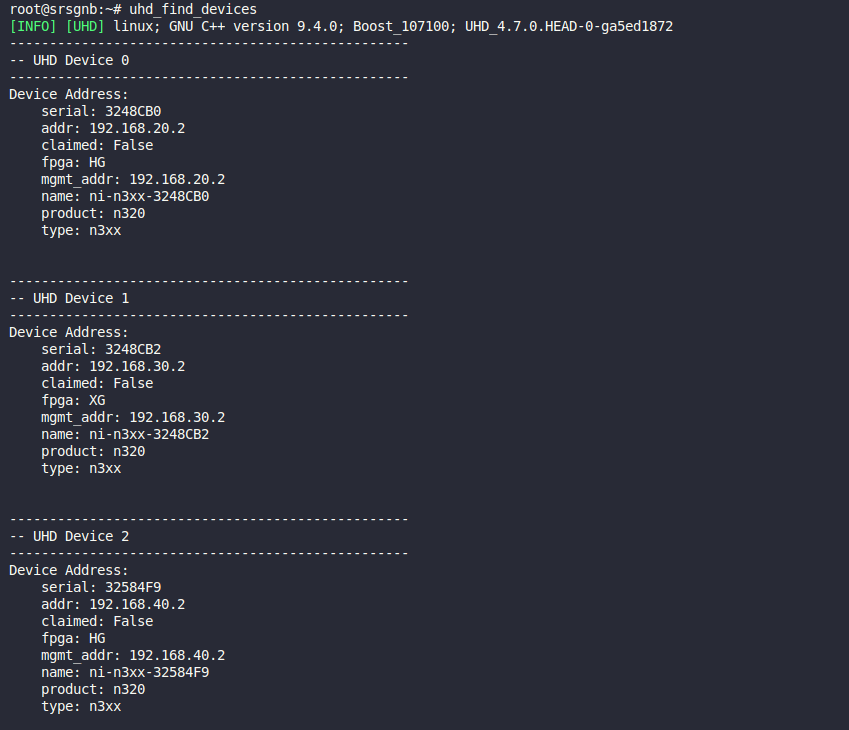
Note: The base station may show multiple SDRs, each corresponding to one sector.
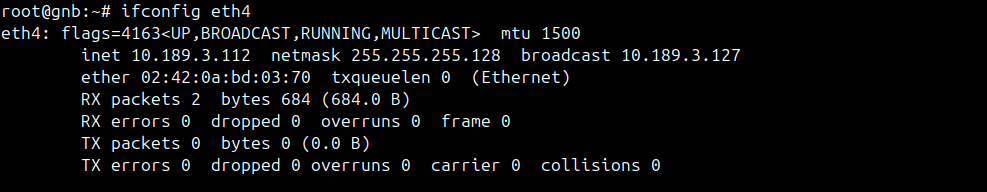
To make the gNB connected to the core network, you need to attach the gNB to the AMF of the core network. First note down the IP address of the interface
eth4of the gNB container by executing the following command in the terminal.# ifconfig eth4For this experiment, we assume that the IP address of eth4 on gNB is 10.189.3.112 as shown below.
Running the gNB: In the gNB container, run the srsgNB with the appropriate SDR address and bind address parameters.
The command format is:
# ./gnb_start.sh -c srsRAN/build/apps/gnb/n320.yml -a <SDR_ADDRESS> -b <BIND_ADDRESS>Where:
-aspecifies the SDR address (depends on the UE you are using)-bspecifies the bind address (the IP address ofeth4from Step 6)-w(optional) specifies the bandwidth in MHz (20 MHz by default)
Use the following table to determine the correct SDR address based on your UE:
User Equipment
SDR Address (
-aflag)CurtissFarm-UE-000, Portable-UE-000, AgronomyFarm-UE-[001, 010], Gilbert-UE-003
192.168.20.2
Horticulture-UE-[000, 001]
192.168.30.2
FeedMill-UE-[000, 001]
192.168.40.2
Example: If you are using Horticulture-UE-001 and your
eth4IP address is 10.189.3.112, run:# ./gnb_start.sh -c srsRAN/build/apps/gnb/n320.yml -a 192.168.30.2 -b 10.189.3.112 --json-metricsNote
When the gNB starts, per-UE metrics such as CQI, MCS, DL/UL bit-rates, SNR, and packet success/drop counts are written to a
gnb_metricsx.jsonfile in the/rootdirectory. See the gNB logs section for how to follow these metrics in real time withtailor inspect the saved JSON after the experiment.Note
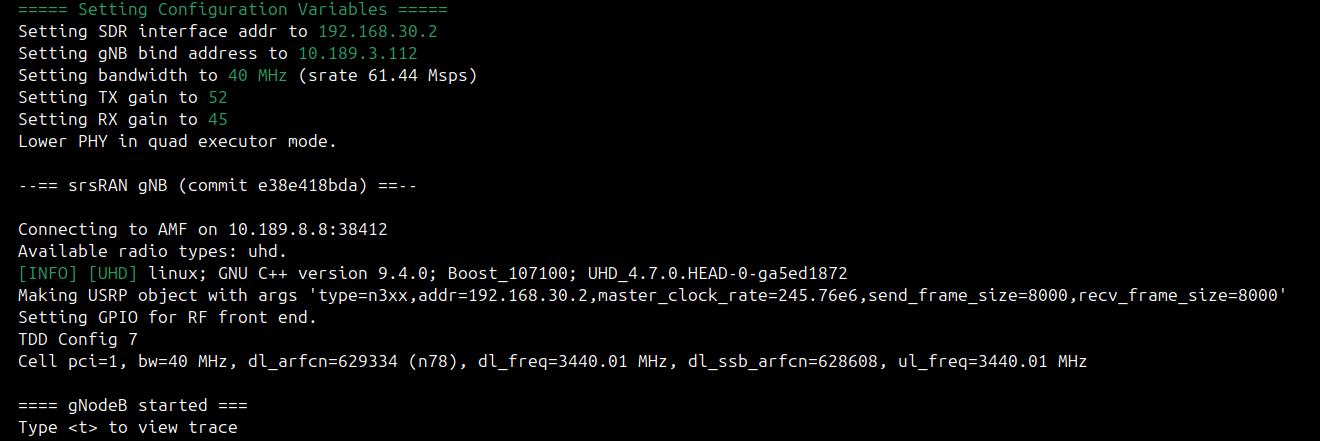
For Horticulture-UE-000 and Horticulture-UE-001: These UEs are located beyond 1.2 km from the base station and require significantly higher TX and RX power to maintain a stable connection. Use TX gain of 52 and RX gain of 45 by adding the
--tx-gainand--rx-gainflags to the command. To achieve maximum throughput, you may also add the-w 40flag to set the bandwidth to 40 MHz:# ./gnb_start.sh -c srsRAN/build/apps/gnb/n320.yml -a 192.168.30.2 -b 10.189.3.112 --tx-gain 52 --rx-gain 45 -w 40 --json-metricsWhere
--tx-gainspecifies the TX gain,--rx-gainspecifies the RX gain, and-wspecifies the bandwidth in MHz.After running srsgNB, your terminal should look like the image below.
Establishing a PDU Session: On the UE container, run the UE start script, which automates the entire process of bringing up the UE, checking registration, and establishing the PDU session.
# ./ue_start.shThe script will perform the following steps automatically:
[1/4] Reboot the Quectel radio
[2/4] Check UE registration to the 5G network (may retry if not registered)
[3/4] Start the PDU session using Quectel Connection Manager
[4/4] Detect the network interface and IPv4 address
After successful execution, the output should look similar to the image below:
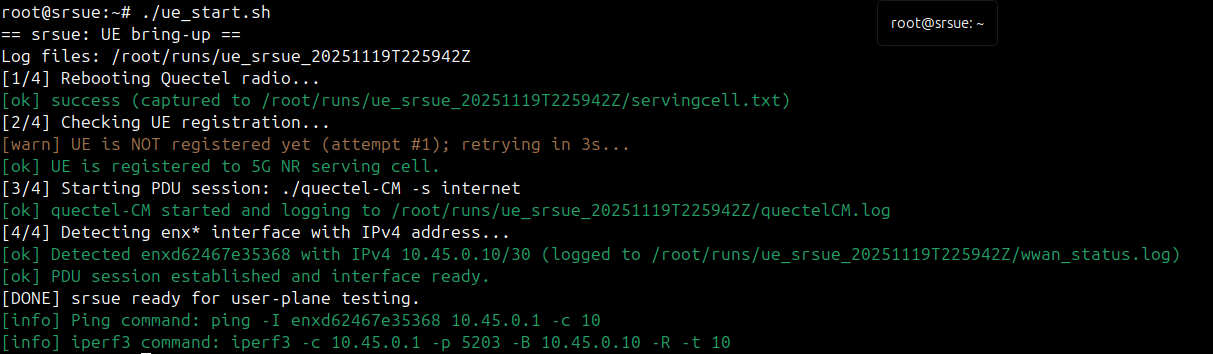
The UE is now assigned an IP address by the Session Management Function of the core network and has a network interface (e.g.,
enxd62467e35368) ready for user-plane testing. The script provides convenient ping and iperf3 commands at the end for your reference.
Latency Experiment
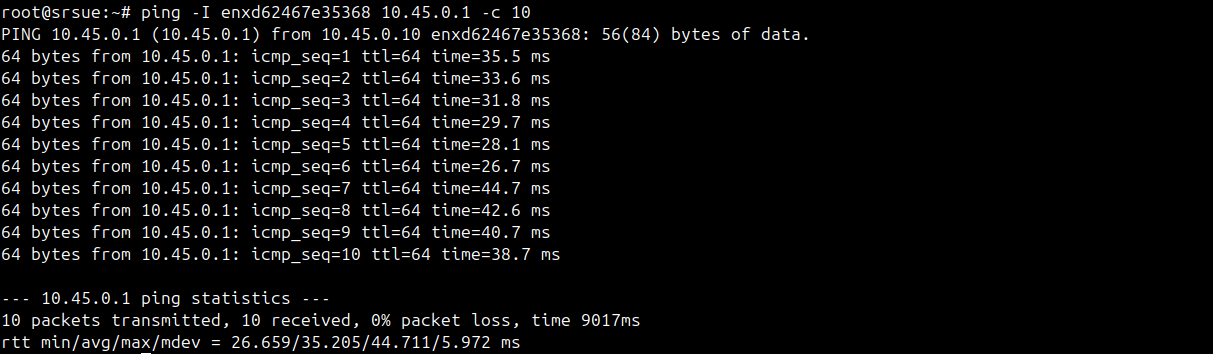
On establishing a successful connection, you may check the latency toward the core network by following the steps.
Ping test to the Core Network: On the UE container, copy the ping command from the output shown in the image above (from Step 8) and run it to ping the core network and ensure stable connection. For example:
# ping -I enxd62467e35368 10.45.0.1 -c 10An example output of the ping command is shown below.
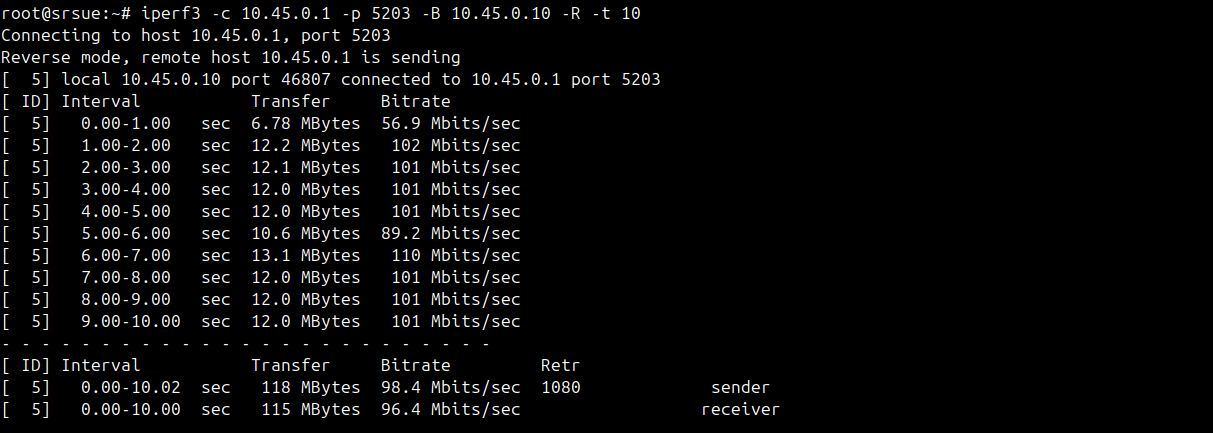
Throughput Test
TCP Throughput Test: On the UE container, copy the iperf3 command from the output shown in Step 8 and run it to measure the downlink throughput from the core network to the UE. The command uses TCP protocol with the
-Rflag for reverse mode (downlink). For example:# iperf3 -c 10.45.0.1 -p 5203 -B 10.45.0.10 -R -t 10Note
Make sure to use your UE’s assigned IP address (obtained from Step 8) in the
-Bflag.The iPerf3 command output shows the downlink throughput as follows.
On the gNB, you can view the console traces with parameters such as bit-rate, CQI, and MCS. To view these parameters, press
tfollowed byENTERinside the gNB container. The srsgNB console trace will display as shown in the image below (while the iPerf3 command is running at the UE).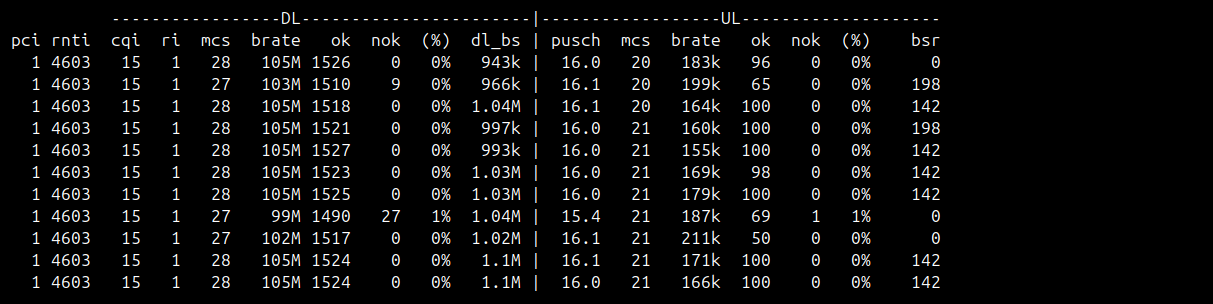
Accessing gNB Logs
The gNB writes per-UE metrics to JSON logs in the
/rootdirectory. Each run creates a file namedgnb_metricsx.json.Log schema (example):
{
   "ue_container": {
      "pci": 3,
      "rnti": 24658,
      "cqi": 7,
      "ri": 1,
      "dl_mcs": 18,
      "dl_brate": 92.5,
      "dl_nof_ok": 12345,
      "dl_nof_nok": 12,
      "dl_bs": 0,
      "pusch_snr_db": 18.7,
      "ul_mcs": 16,
      "ul_brate": 21.3,
      "ul_nof_ok": 6789,
      "ul_nof_nok": 4,
      "bsr": 0
   }
}
Accessing the logs:
Real time during the gNB run (Please open a separate terminal to follow logs):
# tail -f /root/gnb_metricsx.jsonAfter the experiment, open the saved log file:
# nano /root/gnb_metricsx.jsonUse these logs to track CQI, MCS, DL/UL bit-rates, SNR, and packet success/drop rates for each UE while the gNB is running.